

Beta (β), meaning in stocks and investment, also known as risk coefficent, is a measure of a stock’s volatility in relation to the overall market and can be used to measure a stock’s level of risk in the stock market.
What is Beta?
Calculating the beta coefficient will help investors determine the investment object that is suitable for their risk tolerance. By definition, the market, such as the VN-Index, has a beta of 1.0, and individual stocks are ranked according to how much they deviate from the market.
- If β = 1: The volatility of the stock moves is equal to the volatility of the market. That is, the growth of stock follows the direction of the market.
- If β < 1: The volatility of the stock move will be lower than the volatility of the market. That is, the stock has less volatility than the market.
- If β > 1: The volatility of the stock price is higher than the volatility of the market. This means that the stock will have high profitability, and at the same time, the level of risk is also quite large. For example: The β coefficient of stock B = 3 means that when the market increases by 10%, stock B will increase by 30%.
- If β = 0: When a stock has a Beta 0, the stock’s change in value is completely independent of the market. If the sign of Beta is ( – ) then the stock will have opposite movements compared to the stock market and vice versa.
Read more What is Beta in Finance on Wikipedia.
How to Calculate Beta (β)
The Beta calculation general formula
It may seem redundant to calculate beta because it’s a widely used and publicly available metric. But there’re several reasons for you to do it manually:
- The fact that different sources use different time periods in calculating returns. Though beta always involves the measurement of variance and covariance over a period, there is no universal, agreed-upon length of that period. Therefore, one financial vendor may use five years of monthly data (60 periods over five years), while another may use one year of weekly data (52 periods over one year) in coming up with a beta number. The resultant differences in beta may not be huge, but consistency can be crucial in making comparisons.
- You are a software developer and want to develop a tool that calculate beta based on your existing data.
Now, you can calculate the Beta a security by deviding the covariance between the return of the security and the return of the market by the variance of the market returns. The general formular is as below:
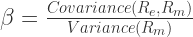
Where,
: the interest rate of the security
: the interest rate of the market as a whole
: The covariance between the
: Measure of how the market moves relative to its mean . For example, variance is used in measuring the volatility of an individual stock’s price over time. Covariance is used to measure the correlation in price moves of two different stocks.
Practice to Calculate Beta
- Download historical security prices for the company stock whose beta you want to measure.
- Download historical security prices for the comparison market.
- Calculate the percent change period to period for both the company stock and the market. If using daily data, it’s each day; for weekly data, it’s each week, etc.
Calculate Beta in MS Excel / LibreOffice Cal / Google Sheet
All those spreadsheet software support calculating variance and covariance using their built-in function as below:
- VAR(value1, [value2, …]): To find the variance of the market by passing all the percent changes of the market to the VAR.S function
- COVARIANCE.S(array_1, array_2): to find the covariance of company stock to the market by passing all the percent changes of the company stock and all the percent changes of the market to the COVARIANCE.S function.
- array_1: The range representing the array or matrix of all the percent changes of the company stock.
- array_2: The range representing the array or matrix of all the percent changes of the market.
Calculate Beta in Python
Starting in Python 3, one can obtain the variance directly from the standard library named statistics.
import statistics

variance = statistics.variance(data, xbar=None)
However, as for covariance, you must use numpy library or you should have at least Python 3.10 as the statistics in Python3.10 now contains the function covariance. In this tutorial, I assume that your have Python 3.10. If not, you could follow my instruction to install Python 3.10 on Ubuntu 22.04.
import statistics

covariance = statistics.covariance(list_1, list_2)
Here is a full example of calculating Beta in Python 3.10:
import statistics

company_stock_interest_rates = [21, 19, 11, 21, 19, 46, 29]
market_interest_rates = [21, 19, 11, 21, 19, 46, 29]

variance = statistics.variance(company_stock_interest_rates)
covariance = statistics.variance(company_stock_interest_rates, market_interest_rates)

# calculate Beta, the output should be 1
beta = covariance / variance
Beta Problem
If a company stock has a beta of 1, then it’s often assumed that company stock will go up or down exactly as much as the market. This is definitely a bastardization of the concept. If something has a beta of 1, then it really means that, given a change in the market, its sensitivity of returns is equal to that of the market.